
What is Technical Analysis?

Technical Analysis simply is a study of market action using data generated by the behavior and psychology of market participants for the purpose of forecasting future price trends. This tool is used to predict the probable future price movement so that investors can have an idea to enter and exit from the market at the right time.
Technical Analysis tools:
There is a wide range of tools to find trends and patterns on charts. Bollinger bands, support & resistance levels, moving averages, Fibonacci retracement, Stochastic oscillator, on-balance volume, accumulation/distribution line, relative strength index etc. are some important technical analysis tools used in the stock market.
Pros and cons of technical analysis:
Pros:
- It helps to identify market trends (Up & Down) so that Investors can identify pattern and trends of stock price movement such as moving upwards, moving downwards or sideways.
- It helps to identify demand zone, supply zone or potential stop-loss zones in order to enter, exit or to avoid big losses.
- It helps to analyze past market behavior, identifying patterns and trends so that anyone can take investment decisions easily.
- It helps to identify clear entry and exit points for traders.
- It is best for risk management.
Cons:
- It is not 100% accuracy. Sometimes technical indicator or chart pattern suggests a particular trend but the price movement ultimately fails to follow. This means false signals may occur in sometimes to lead losses.
- Technical indicators and chart patterns can be subjective. One analyst sees as a buy signal where as another may interpret differently.
- Technical indicators mainly based on the price and volume movement of particular stocks. It may not account for fundamental factors so that no one can have idea about companies earnings, revenue growth and over all companies financial condition which in turn can affect its stock price.
- Technical indicators are basically useful mainly for traders only.
- It consumes time for frequent monitoring of price movements and analysing multiple charts and indicators for several different securities.
Some Major Technical Indicators:
- Bollinger Bands
- Moving Average Convergence Divergence (MACD)
- Relative Strength Index (RSI)
- Fibonacci retracement
- Ichimoku Cloud
- Stochastic oscillator
- On-Balance Volume Indicator (OBV)
- Accumulation/ Distribution Line Indicator (A/D)
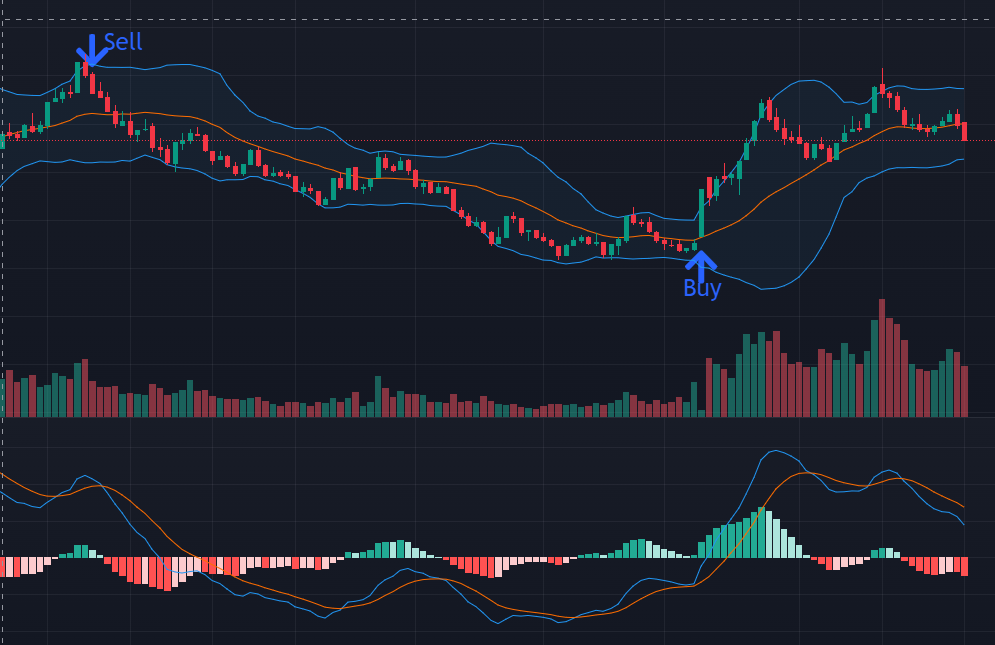
Bollinger Bands:
It is a technical analysis tool consisting of a set of three lines that represent volatility of the asset to know the overbought, oversold or sideways condition. This helps to identify potential entry and exit points for trades. When Band contracts, it indicates low volatility and when band expands, it indicate high volatility.
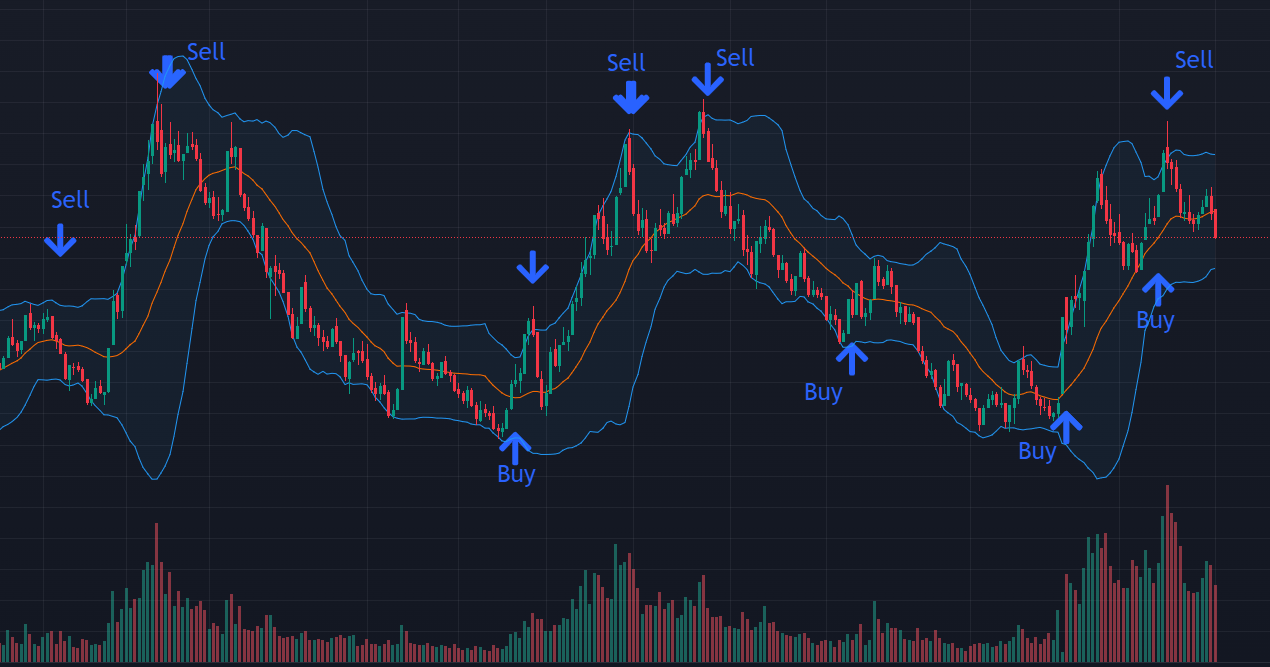
When the price of an asset is trading near the upper Bollinger Band, it is considered as overbought which may indicate the price is likely to fall in near future. Similarly when price is trading near the lower Bollinger Band, the price may rise in near future.
Traders can take a decision for entry and exit with the valuable information about the price movement within the Bollinger Bands position.
Moving Average Convergence Divergence (MACD):
One of the popular technical indicator appreciated by traders worldwide is MACD. Due to simplicity and flexibility, anyone can understand trend or momentum of stock easily.
It appears on the chart as two lines which oscillate without boundaries.
In general, MACD crossing above zero line is considered as bullish while crossing below zero is bearish. There are three different elements involved with the histogram.
Relative Strength Index (RSI):
RSI is an oscillator which will read a value between zero to hundred, providing insights into overbought or oversold conditions. If RSI reading below 30, traders will often think that price action has been week and the asset being charted may be oversold. If RSI reading above 70, then price action has been strong.
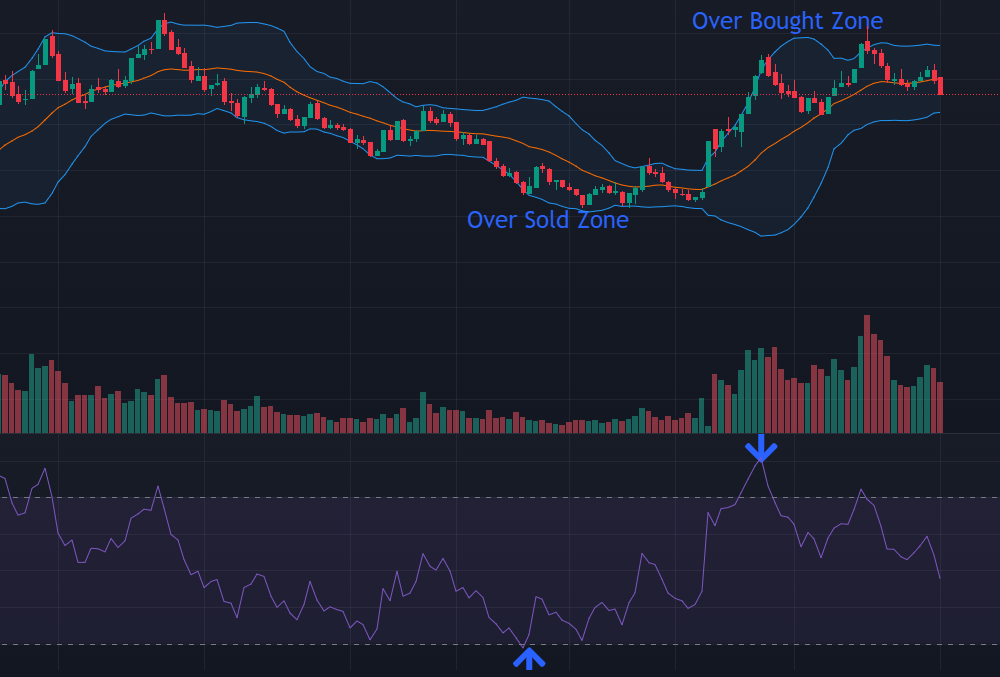
So, Sell position is opened if RSI line crosses the level 70 from above and buy position is opened if RSI line crosses the level 30 from below.
Fibonacci retracement:
Fibonacci retracement levels are horizontal lines that indicate the possible support and resistance levels. Fibonacci retracement levels are found with the help of recent significant swing highs and swings lows.
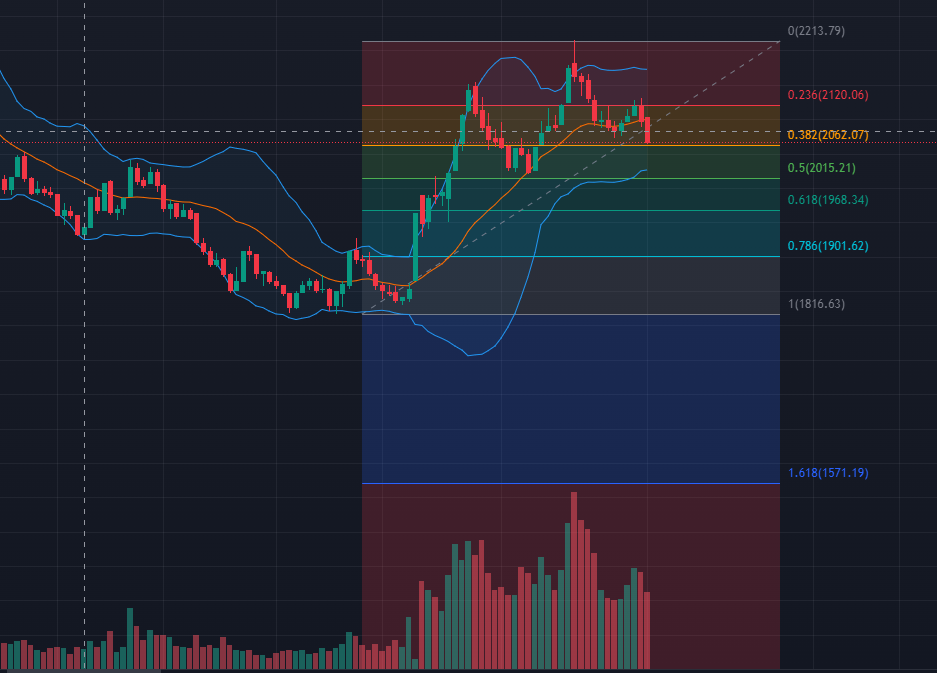
The key Fibonacci ratios are 23.6%, 38.2%, 50%, 61.8% and 100%. These ratios are potential support and resistance levels. If prices break through a support or resistance levels, traders may look to enter or exit a trade accordingly at these levels.
Ichimoku Cloud:
Ichimoku Cloud is a particular technical indicator commonly used by traders worldwide today. To trade with the help of ichimoku Cloud, traders should understand all the components that make up an ichimoku chart.

Ichimoku Cloud users always watch the price movement position within the Cloud. If a price is avove the cloud, it suggests that price is in rising trend. Similarly, if the price is below the cloud, it represents that price is in falling trend. Flat market is indicated if the price of the stock is inside the Cloud.
Stochastic oscillator:
It is a momentum indicator used to generate overbought and oversold trading signals within the zero to hundred bounded range of values. Generally, the value 80 is considered in the overbought range and reading under 20 is considered oversold. Traders can simply wait for a stochastic signal for shorts or long setups.

Divergence between the stochastic oscillator and trending price action is also important for indicating reversal signal.
On-balance Volume Indicator (OBV):
On-Balance volume (OBV) is a technical indicator that uses volume flow to predict future changes in stock price.
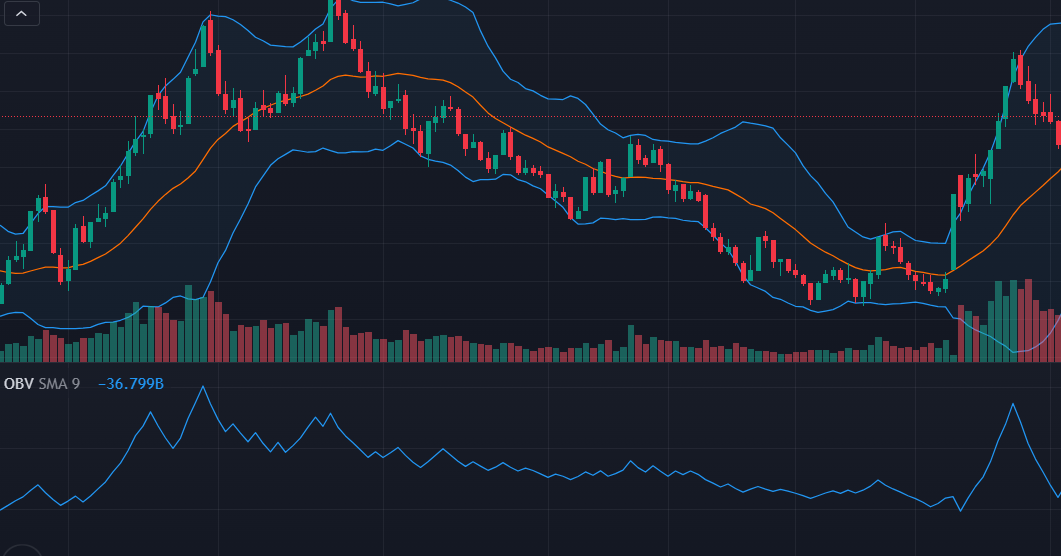
The indicator simply runs a total of positive and negative volume. Rising OBV means that the volume of up days is rising which could be a sign of more buyers in the market than sellers. On the other hand, falling OBV means that the volume of down days is falling and there are more sellers in the market than buyers.
Accumulation/ Distribution Line Indicator (A/D):
This is also a very popular technical analysis indicator that can help to identify changes in market trends. The purpose of the Accumulation / Distribution Line indicator is to find whether an asset is being bought or sold. If A/D line is rising, there is buying pressure and falling indicates selling pressure.
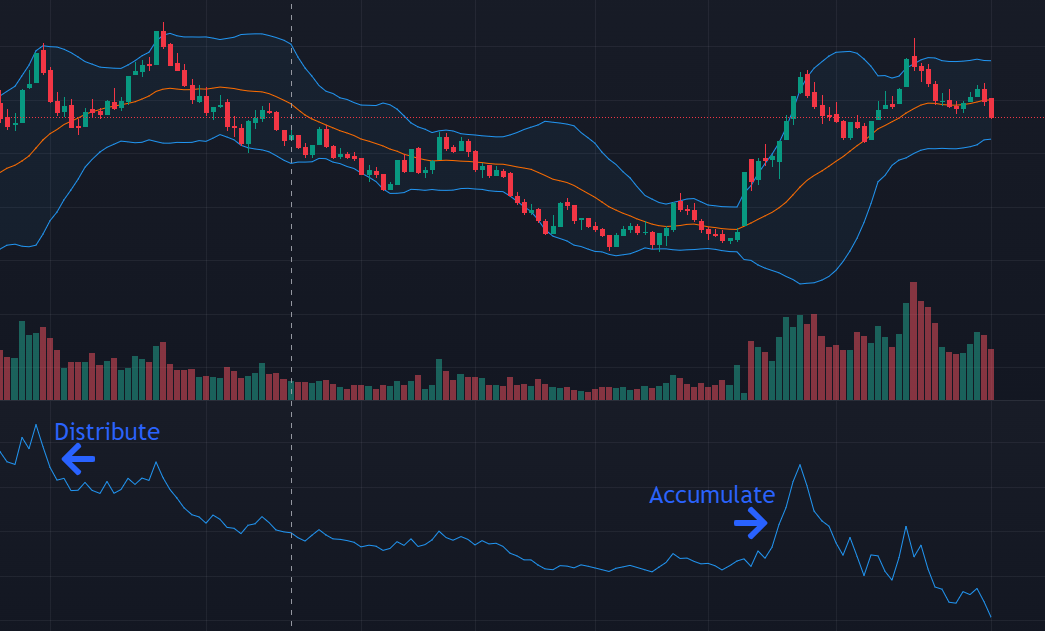
Upward trend continuation, downward trend continuation, breakouts to the upside and breakdowns to the downside is easily seen in the A/D line chart to conform the buying or selling pressure.